Brimstone Moth
Ranked #28 Using count data for all years.
Flight Season - Summer-Autumn.
Platinum (Frequent Fliers Club).
LifeStages:
|
Foodstuffs
|
Moth Ranking for all species and for moths within the same end of season
| Cat2 | 2008 | 2009 | 2010 | 2011 | 2012 | 2013 | 2014 | 2015 | 2016 | 2017 | 2018 | 2019 | 2021 | 2022 | 2023 |
|---|---|---|---|---|---|---|---|---|---|---|---|---|---|---|---|
| All Species | 12 | 35 | 53 | 41 | 21 | 23 | 22 | 35 | 13 | 11 | 22 | 32 | 19 | 25 | 21 |
| Season End | 10 | 16 | 21 | 17 | 6 | 12 | 10 | 16 | 7 | 7 | 9 | 11 | 8 | 11 | 4 |
Yearly Sum from 2008 to date with linear trend.
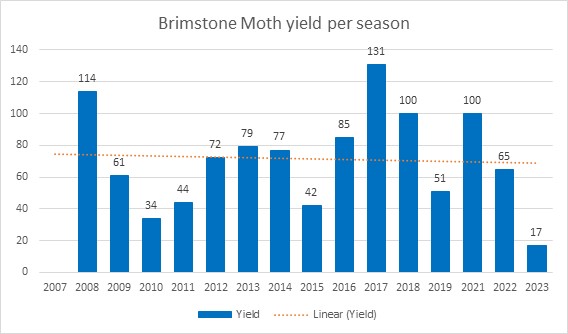
(Yearly Sum is the sum of weekly maximum count values for each year)
Annual flight seasons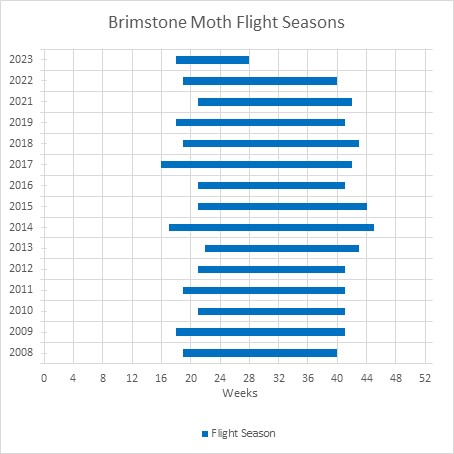 Shows the week in which the moth appeared and disappeared for each year where records exist |
|
Maximum count per week comparing each year with average of all years
 |
 |
 |
 |
 |
 |
 |
 |
 |
 |
 |
 |
 |
 |
 |
- There must be at least 3 data points (IE a moth has to have been seen for at least three weeks within the year) for a graph to be shown
- If only the blue line is visible, there were no counts for that week in the year
- If only the brown line is visible, the blue line (avg all years) is hidden beneath it
- The blue line is identical in all charts, but the vertical axis may be resized, which alters it's appearance